
Public data that people can find.

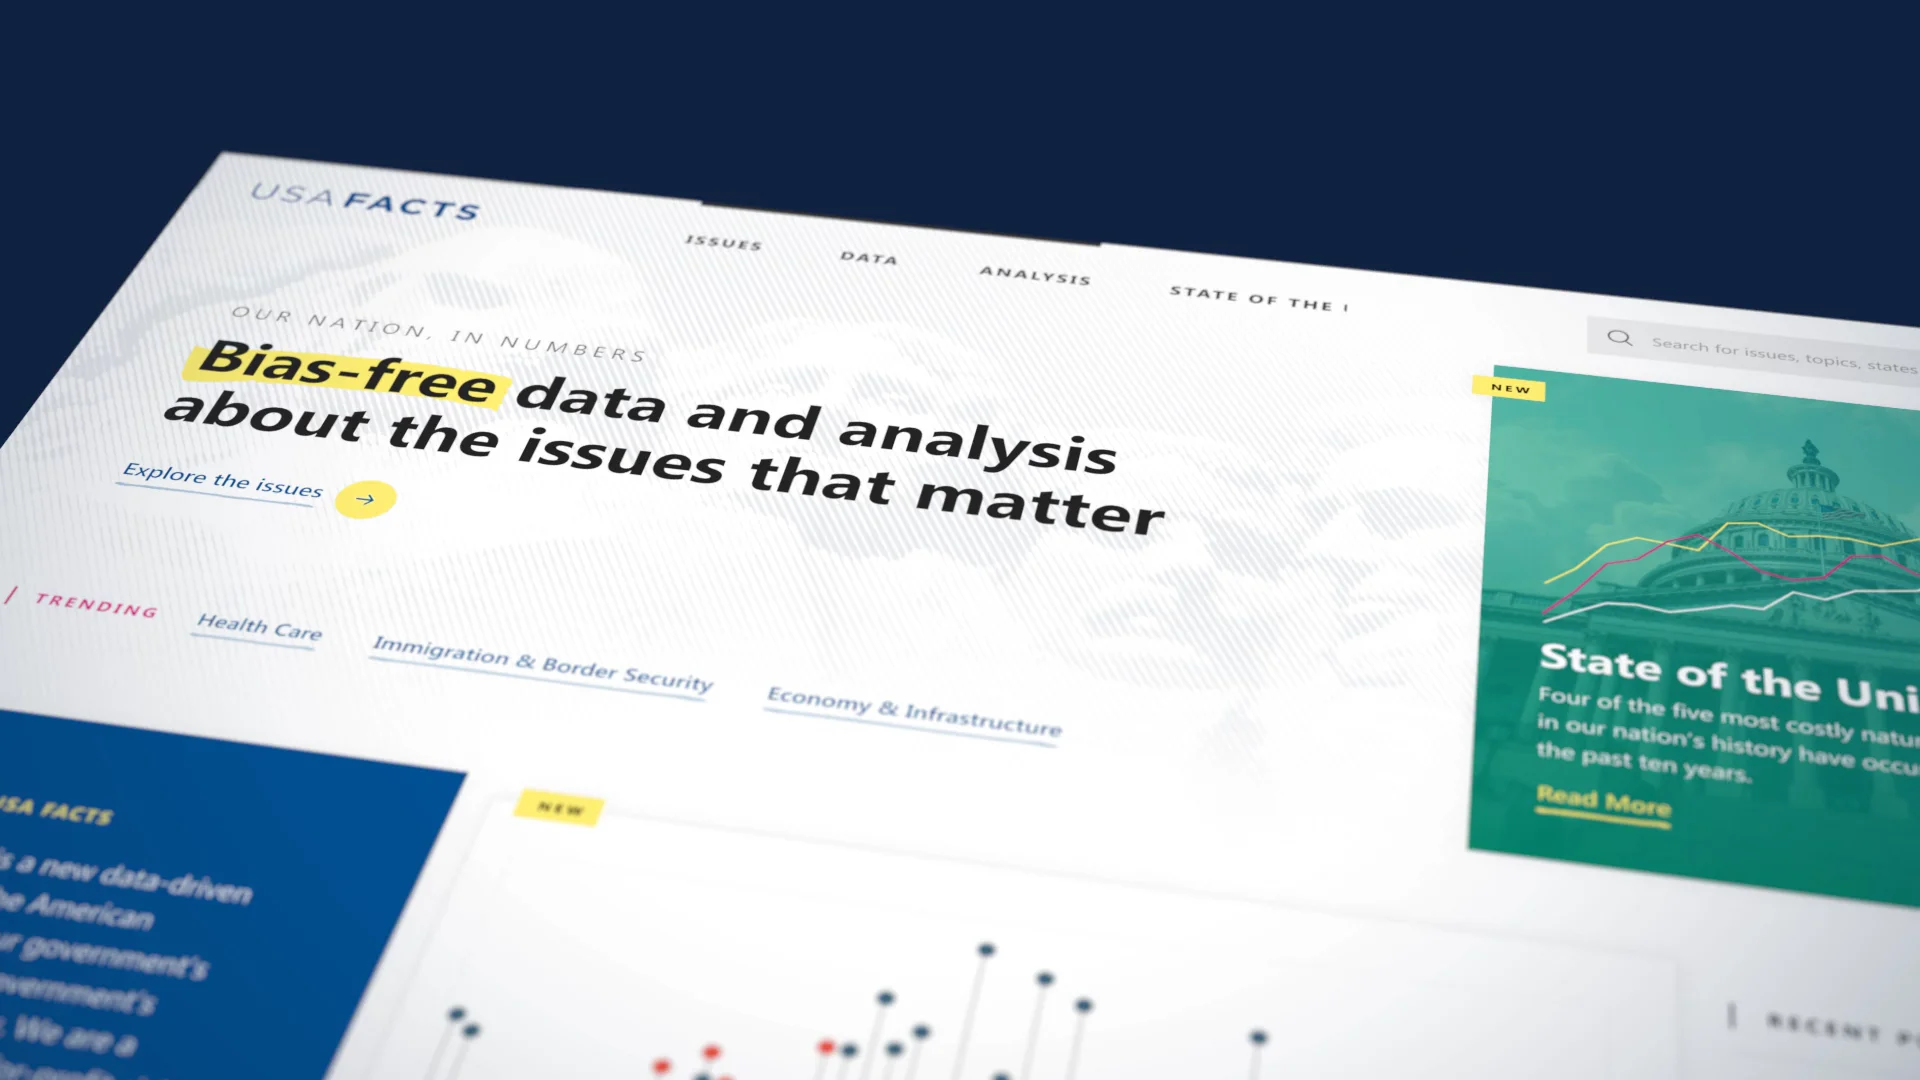
- Client
- USAFacts
- Sector
- Government data and public information
- Disciplines
- Digital Product, Story and Experience
Introduction
The first version of USAFacts was organized by the preamble to the Constitution. It was a principled idea, but nobody looks for crime rates or the federal budget that way.
Former Microsoft CEO Steve Ballmer founded USAFacts to give Americans one nonpartisan place to find government data. The idea was sound and the data was real: more than 80 sources, managed by USAFacts, Penn Wharton and Ballmer’s tech team. But people arrived, couldn’t find their way, and left. The site had to explain itself in seconds.
We redesigned how people find, read and share that data, and we built the platform that holds it. Darkhorse Analytics led the data visualization, and the team worked across two countries and several cities. The launch had to land before the 2020 State of the Union.

Navigation
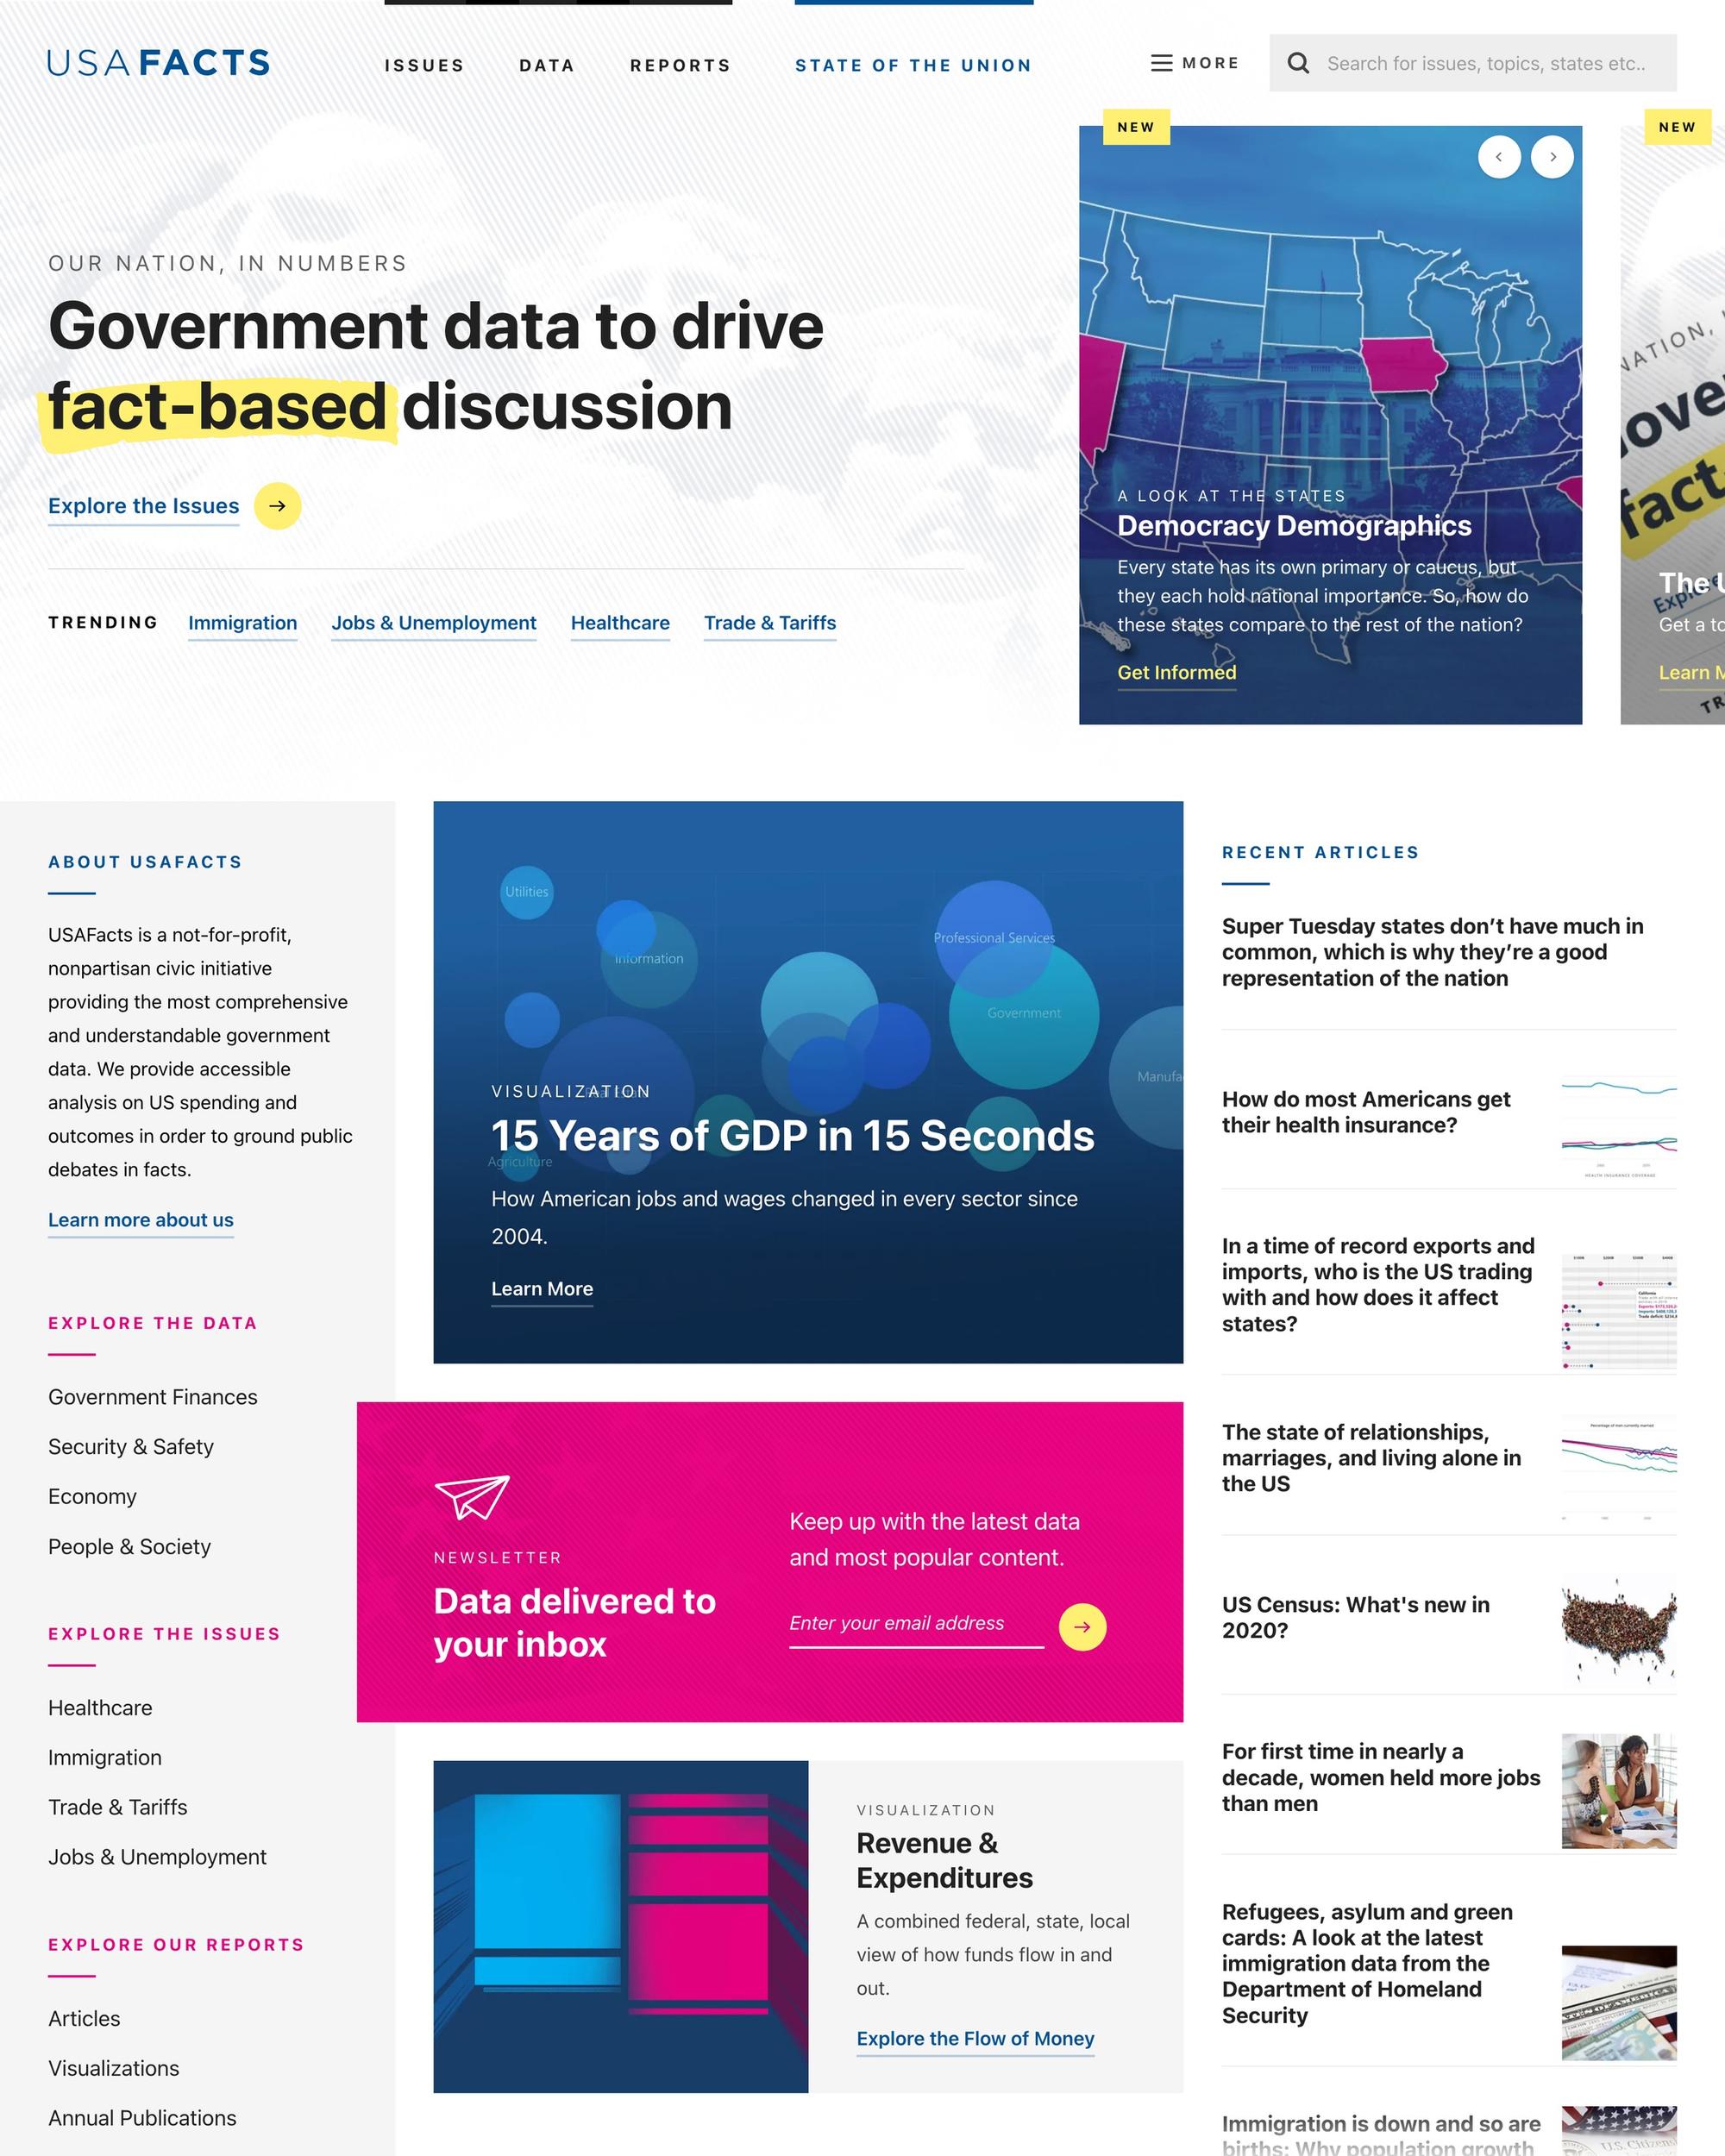
Organize it the way people ask.
We took the old site apart and mapped how people moved through it. We also studied how government data sites, news outlets and political blogs present the same kind of information.
Then we replaced the preamble with a taxonomy built on topics and government services, the things people already have questions about. That taxonomy is still how USAFacts is organized today.

Design and charting systems
Thousands of facts, one visual language.
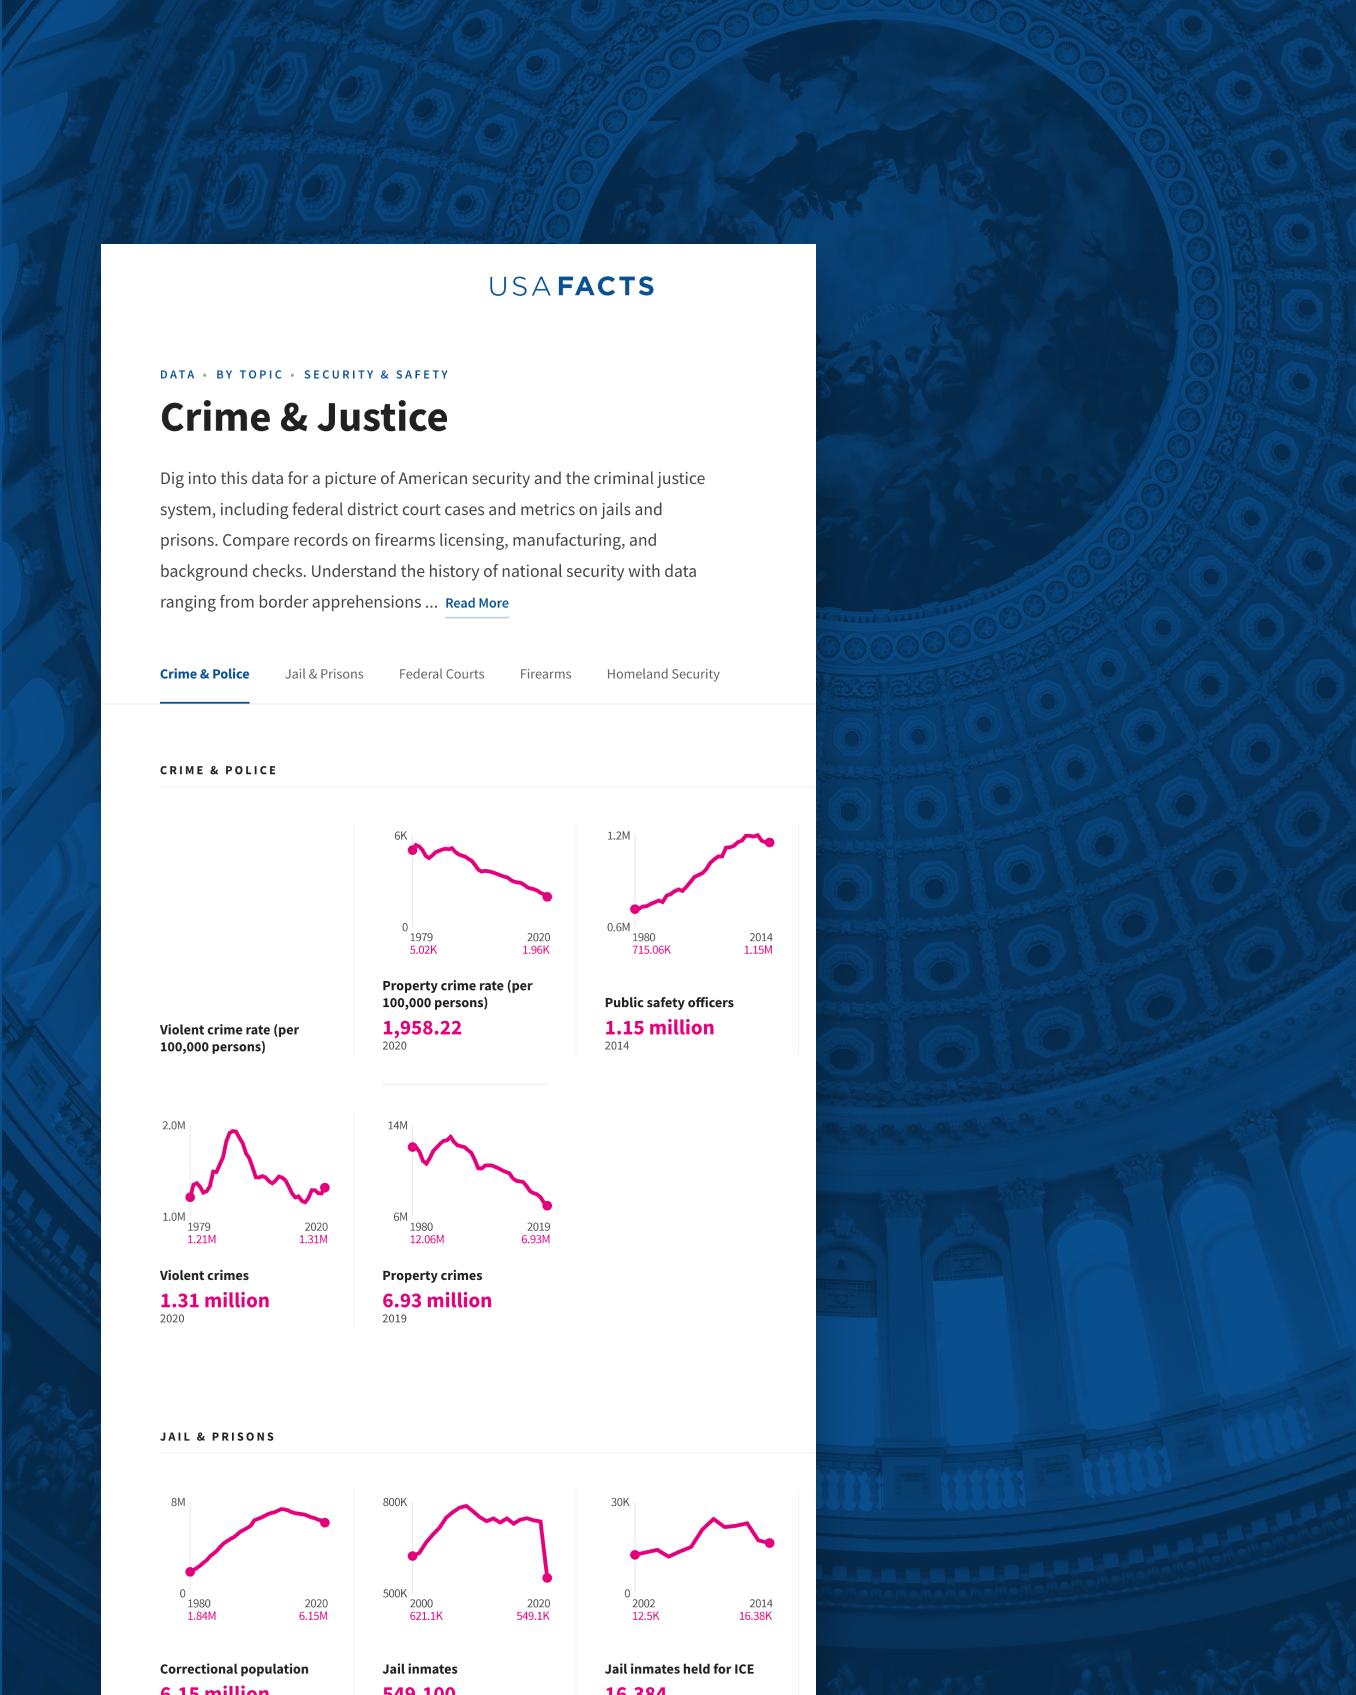
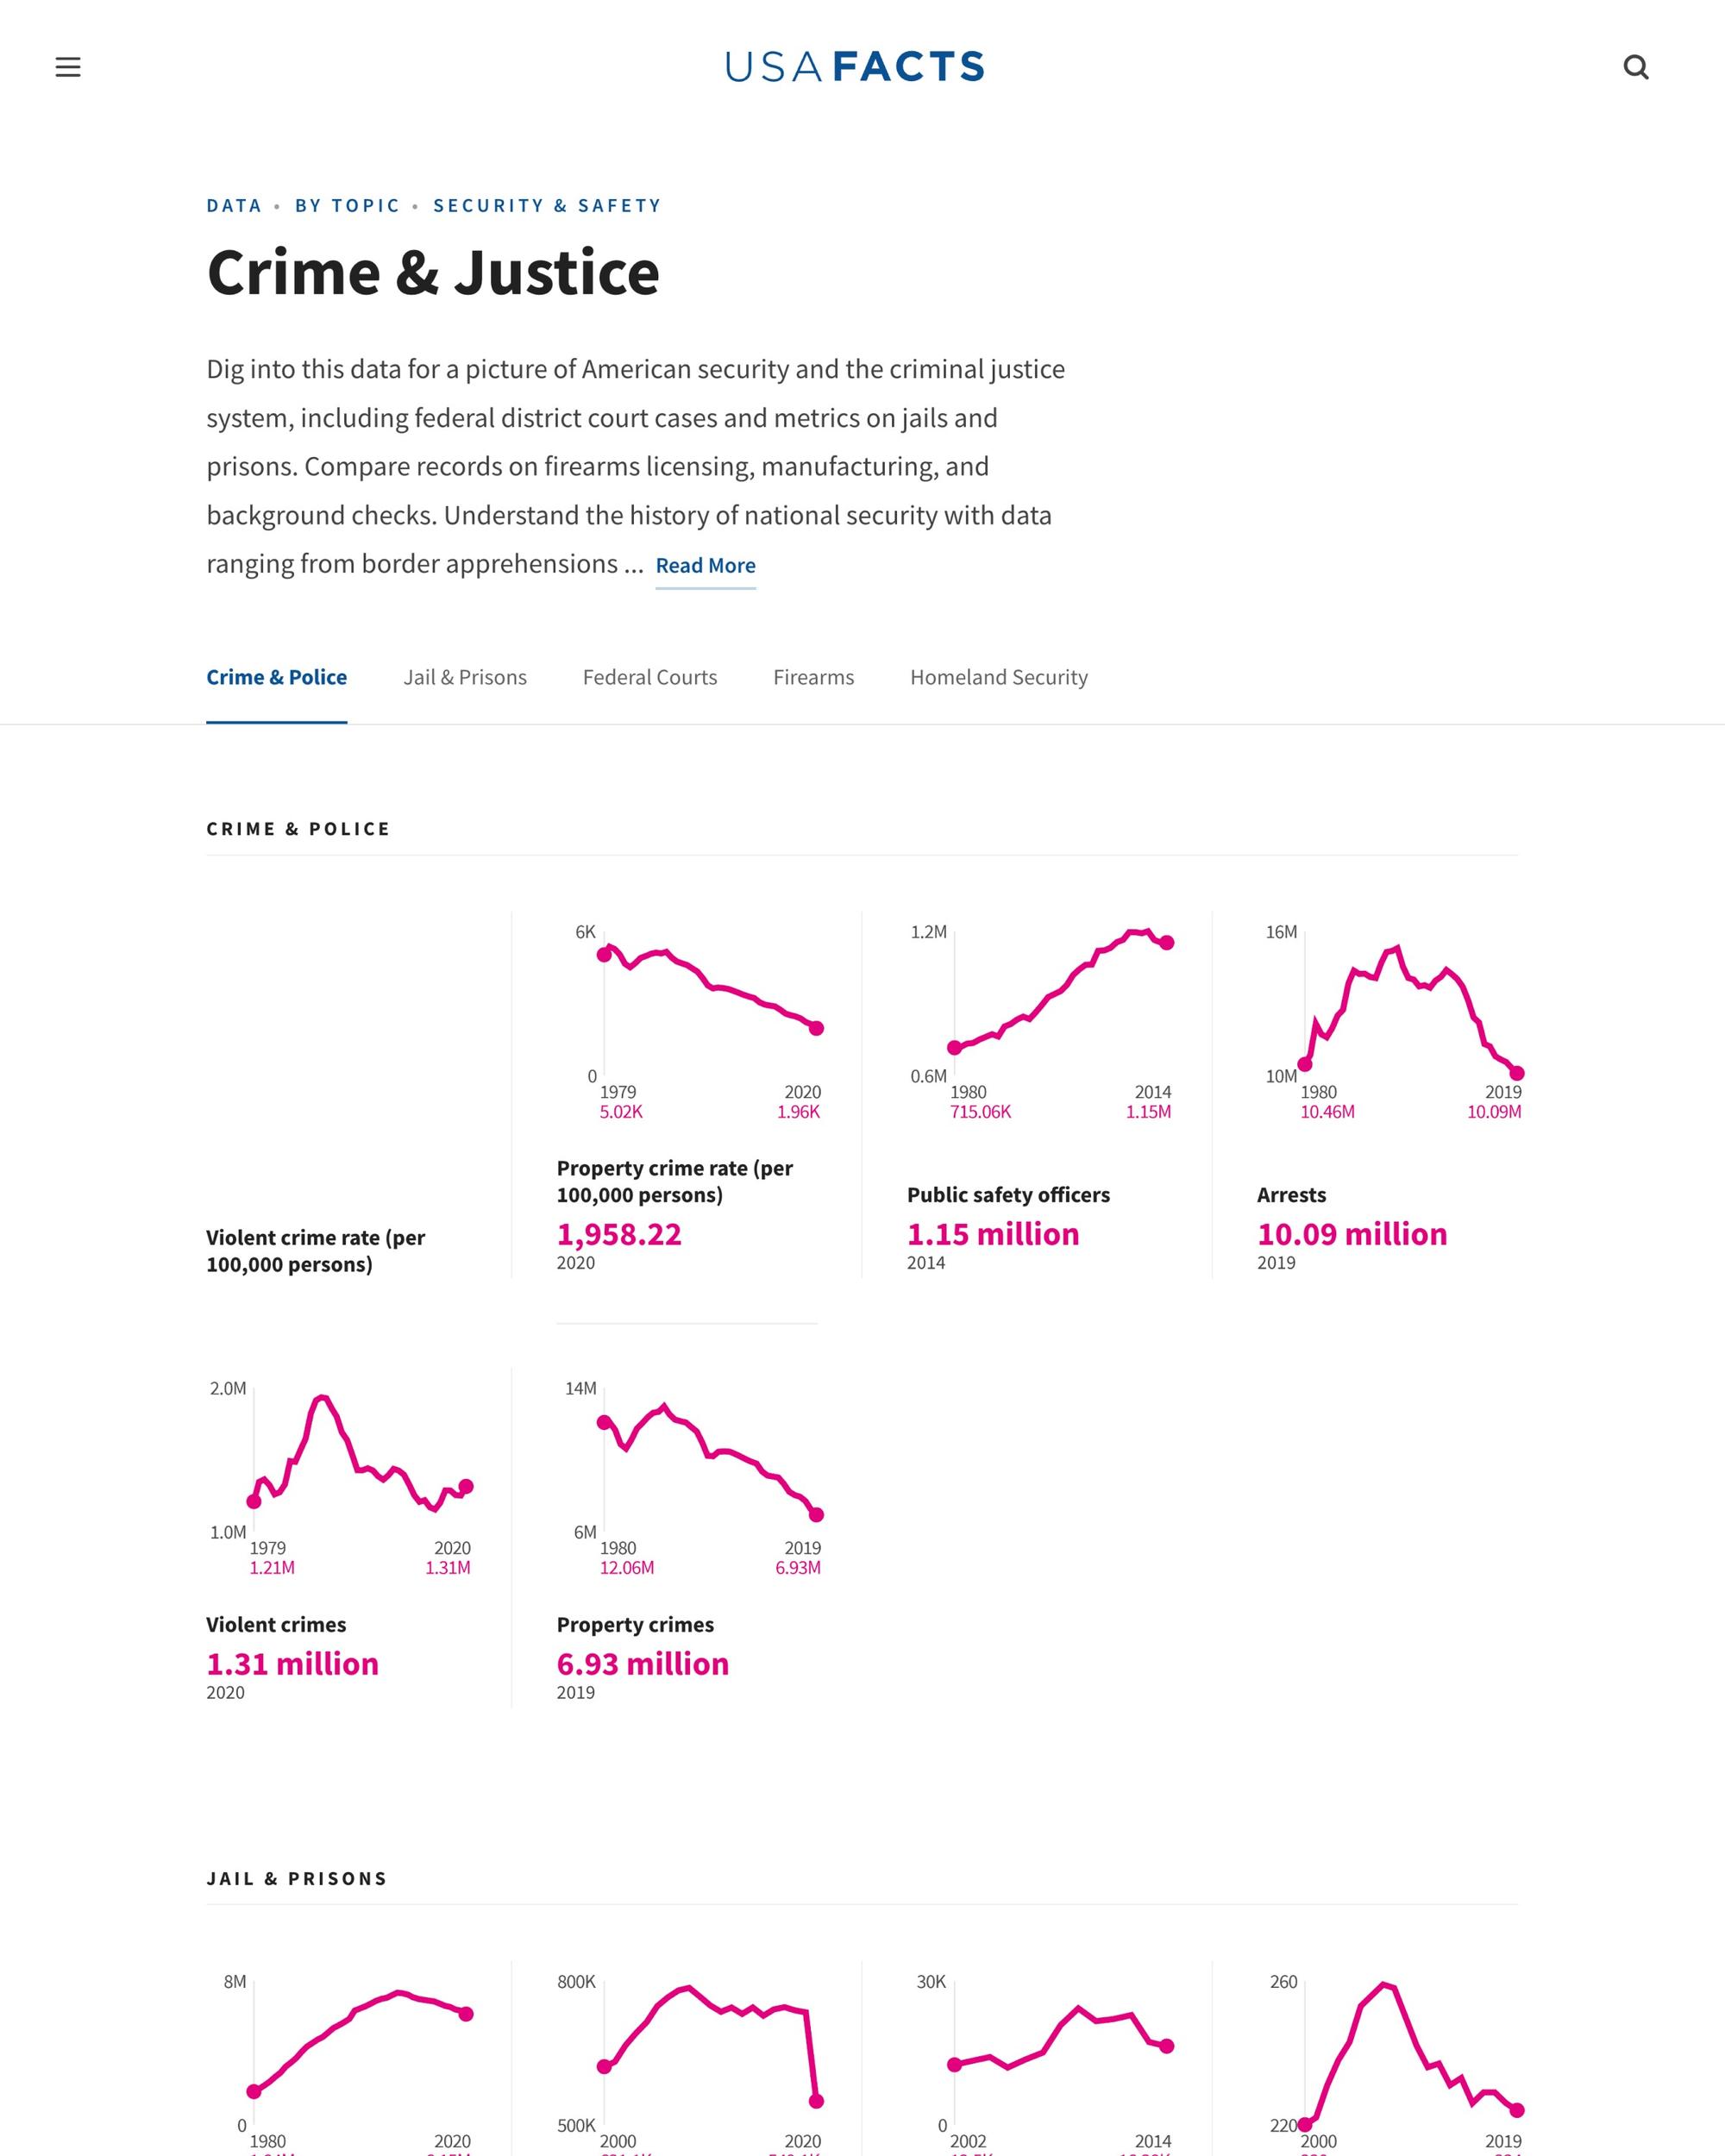
USAFacts publishes thousands of micro facts. Each one is a single figure, chart, graph or sparkline tied to a source. If each is designed one at a time, that volume becomes noise.
We built a design system and a charting system, developed with Darkhorse Analytics, so every figure renders and reads the same way. Darkhorse designed the more complex visualizations, and we built most of those too.
- 01
Neutral and readable
Nonpartisan data should look nonpartisan.
- 02
Generated charts
Sparklines and standard charts come from the system, not drawn one by one.
- 03
Complex visualizations
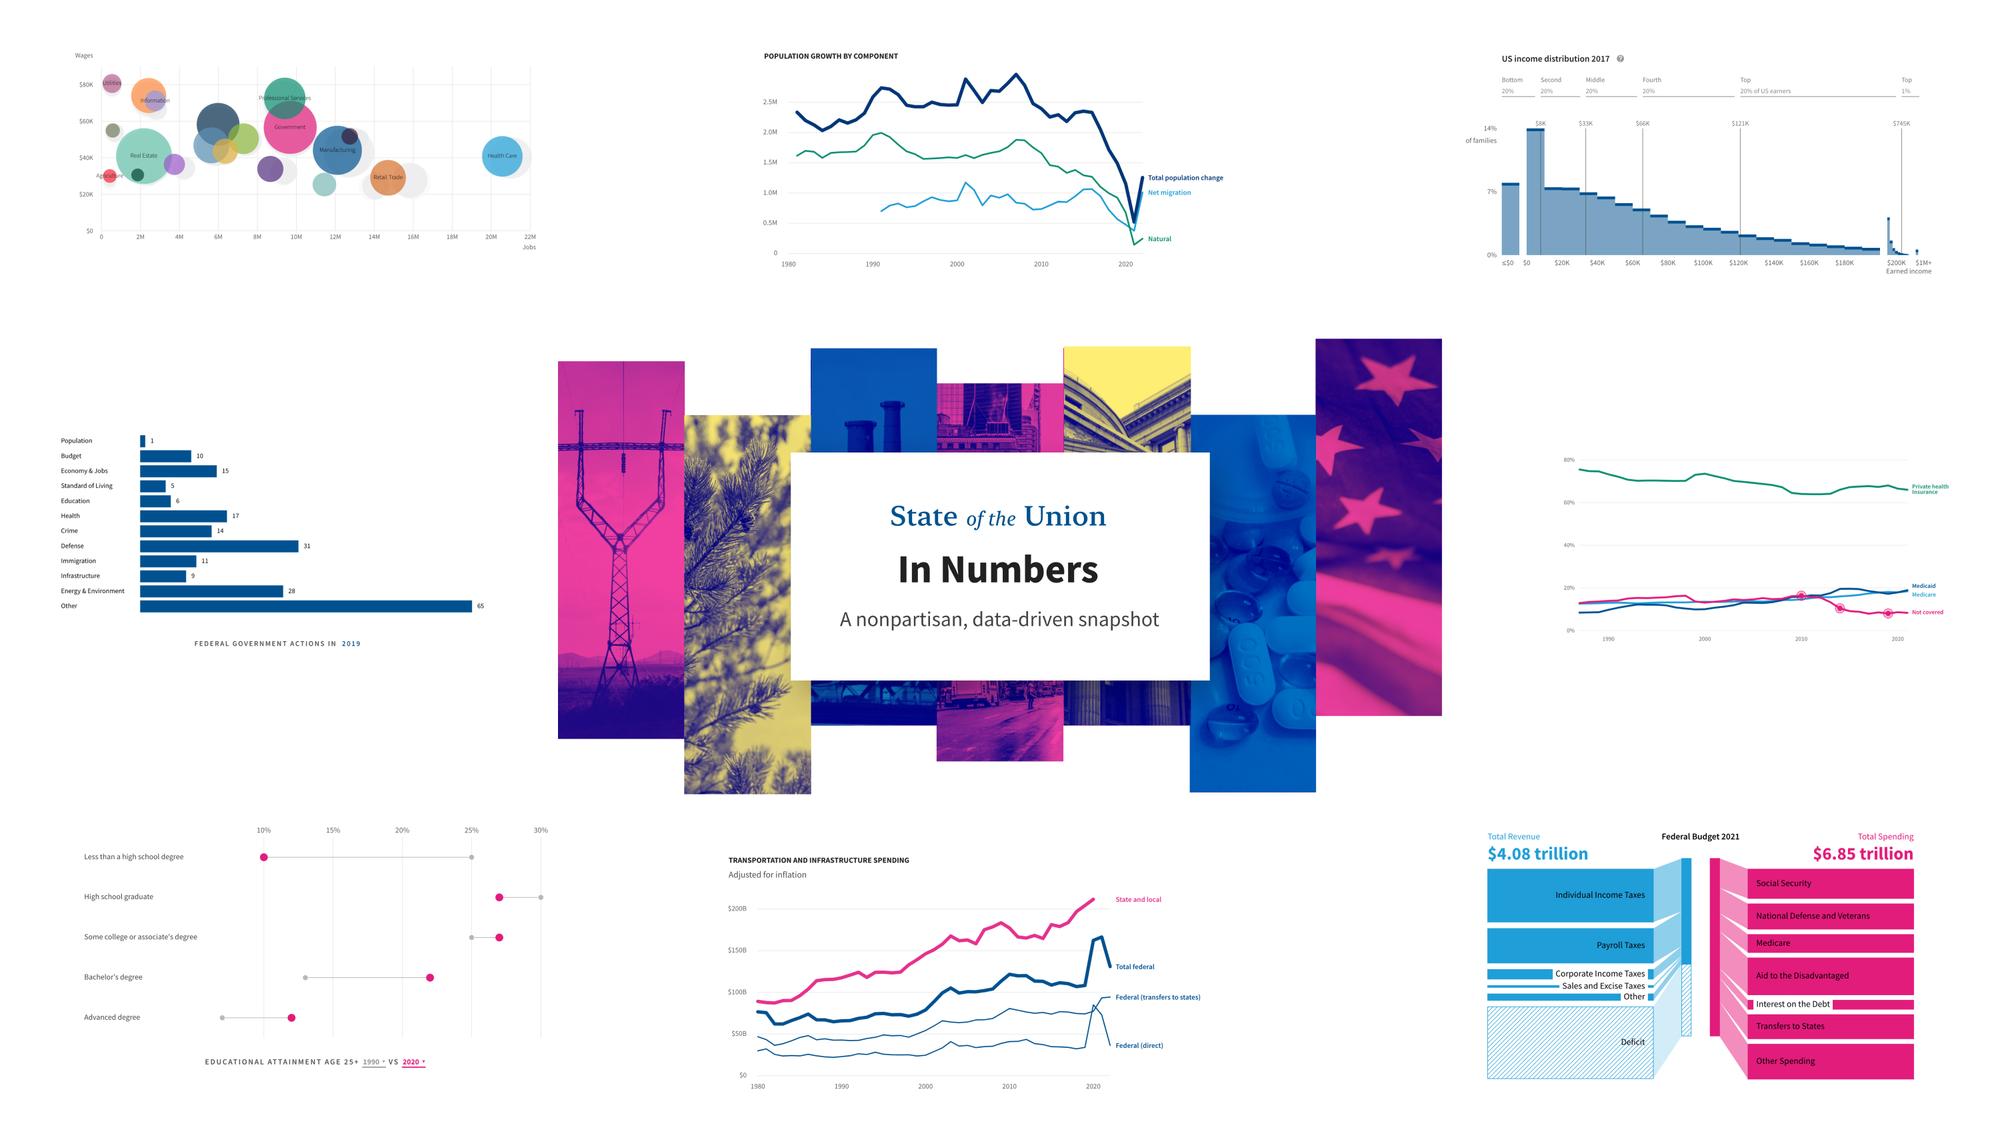
Designed by Darkhorse Analytics and built by Lift.
- 04
Data tables
Sortable data and cohort tables for readers who want the raw numbers.

CMS and State of the Union
Built for an editorial team, and a date that couldn’t move.
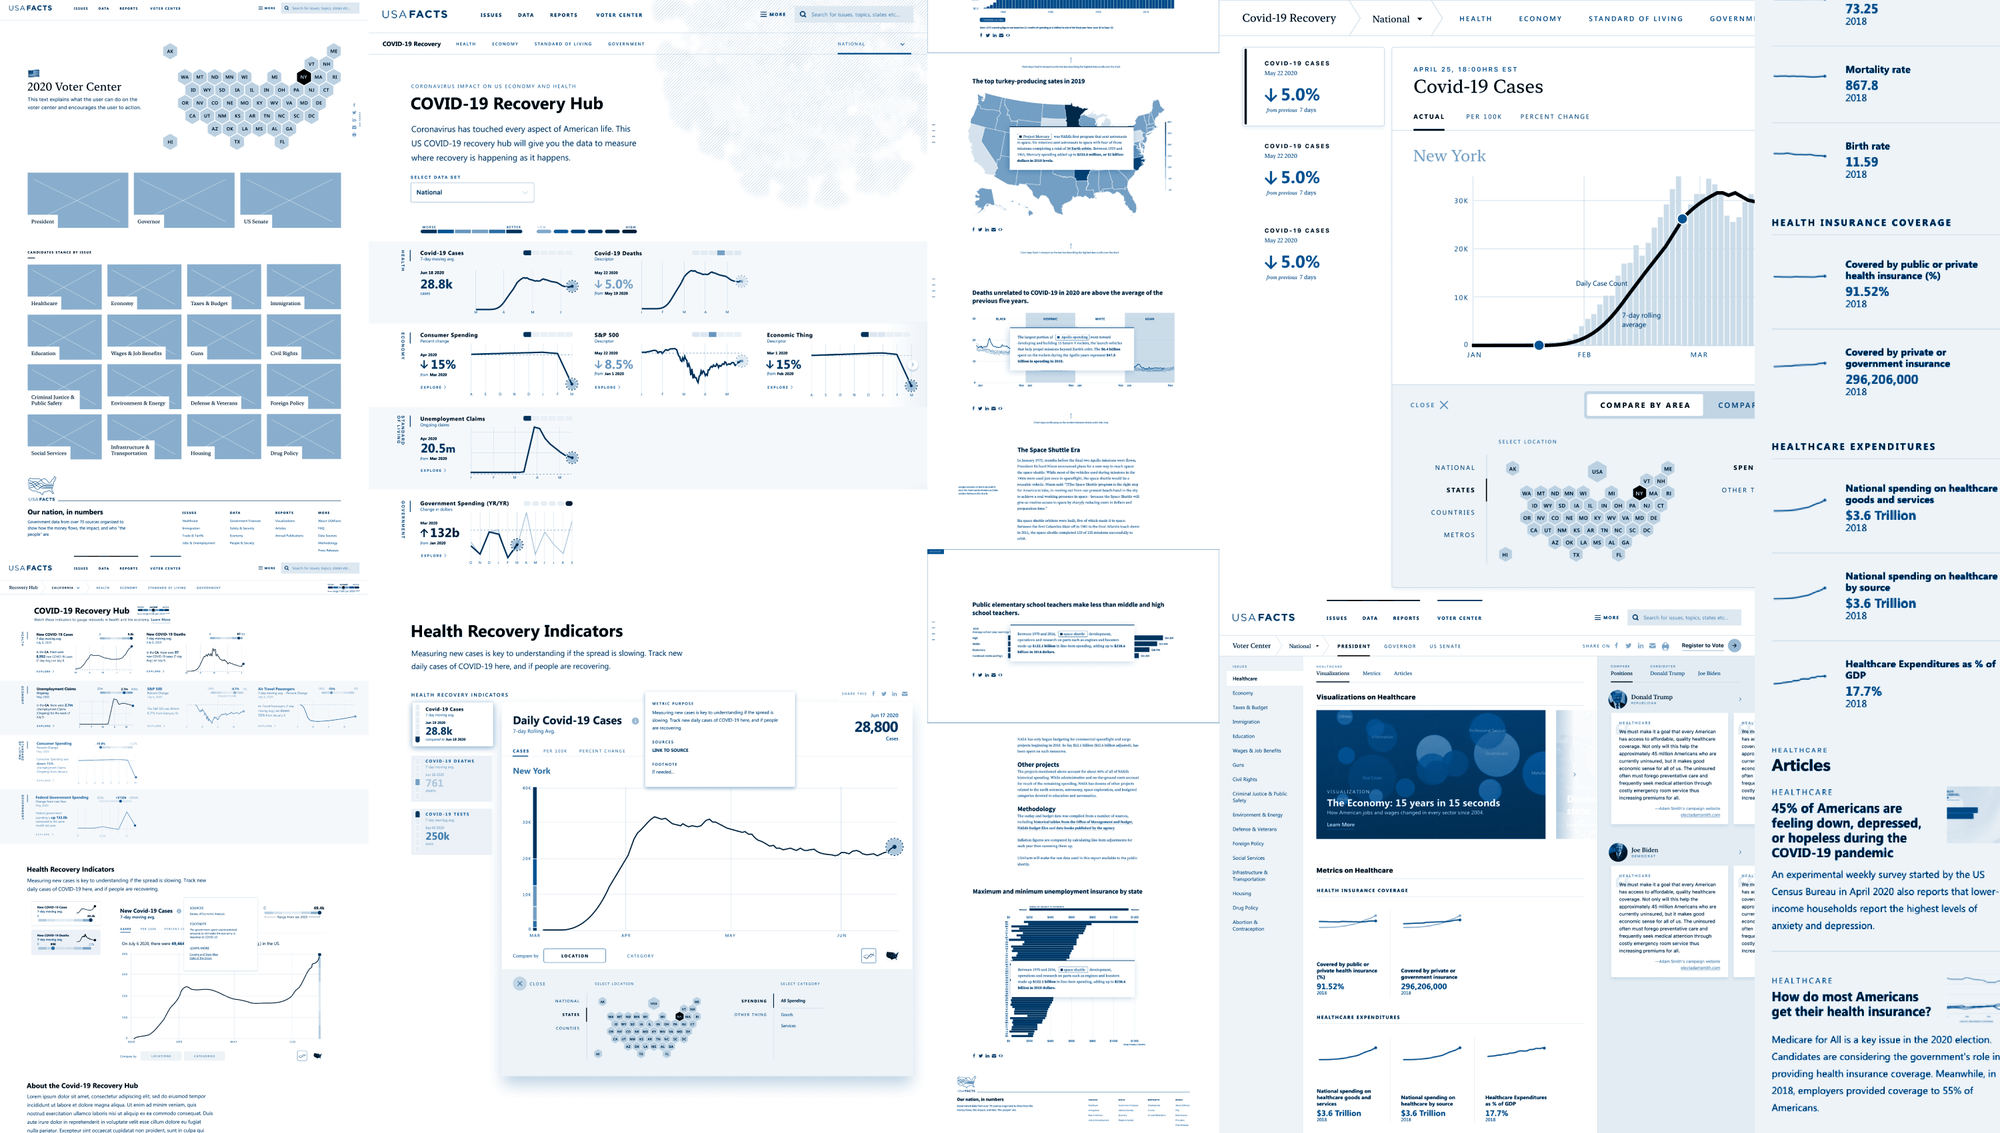
The USAFacts team needed to publish and update micro facts and editorial explainers without waiting on developers. We built a custom Django CMS with modular content blocks, so editors can put together a data page or a long-form explainer from the same parts. The front end is built to match.
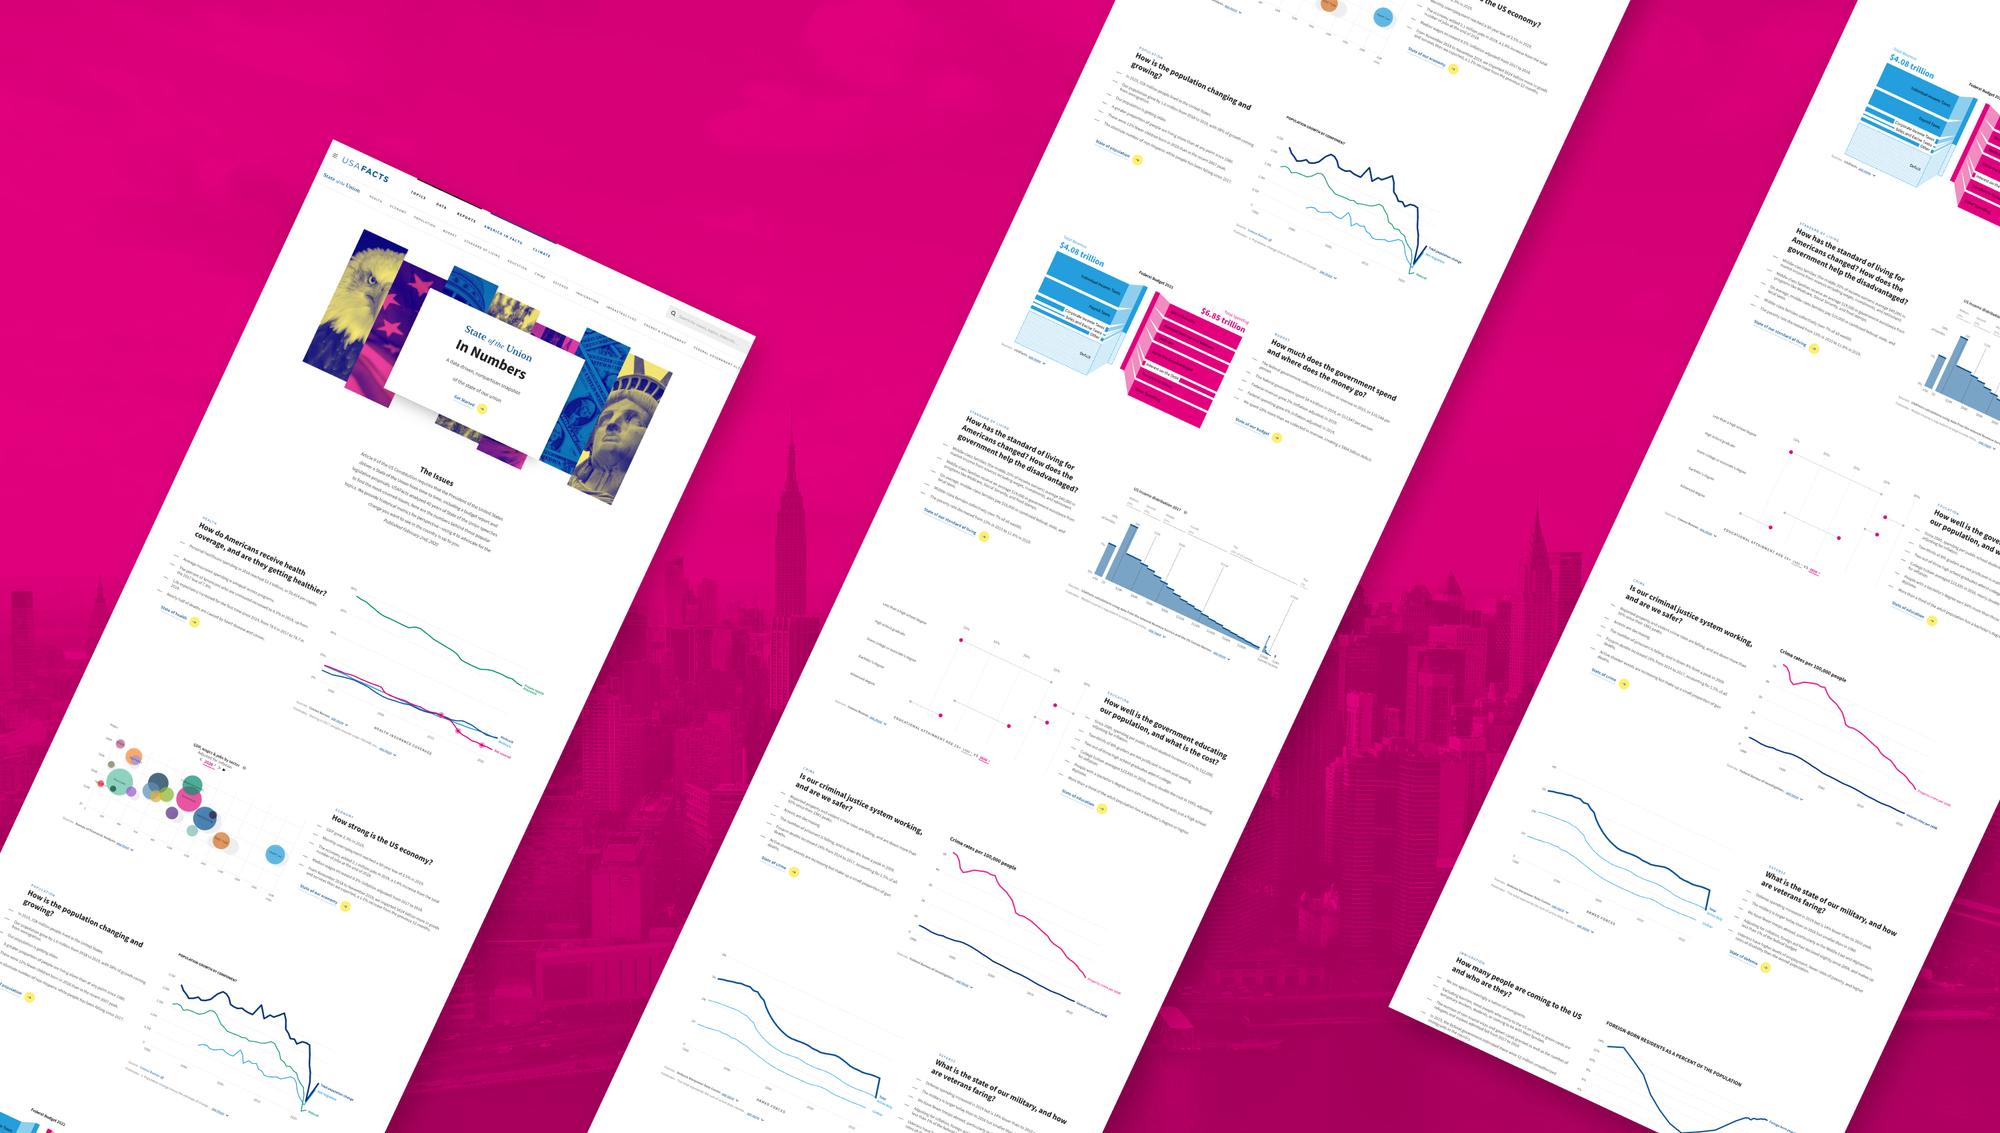
For launch, we built State of the Union in Numbers. It measured the country across twelve areas: health, immigration, defence, crime and justice, budget, education, economy, infrastructure, population, environment, energy and standard of living. It went live in time for the president’s address.
- 01
Custom CMS
For micro facts and long-form explainers.
- 02
State of the Union in Numbers
A standalone feature on the same platform.
- 03
Scrollytelling
Added later: the chart changes as the reader scrolls, and editors control each step from the CMS.

Where it stands
The redesign launched before the State of the Union, and was covered by national news outlets.
The work continued after launch. We added new storytelling formats and reworked the front end for speed, with code splitting, critical CSS and lighter images. The taxonomy we designed still organizes the site.
897%
Organic new users, year over year
1,306%
Organic growth on mobile
36,760
Offsite shares
3
Webby nominations
1
Webby Award
Services
Digital Product
- Information architecture
- Navigation and wayfinding
- User research
- UX and UI design
- Design system
- Content planning
- Accessibility
- Technology selection
- Front-end development
- Back-end development
- Custom CMS
- Charting system
- Data tables
- Custom search
- Performance optimization
- SEO
Story and Experience
- Motion design
- Photography and graphics direction